Australia Freight Forwarding Market Analysis by Mode of Transportation (Air, Sea and Land)
Overview
Executive Summary
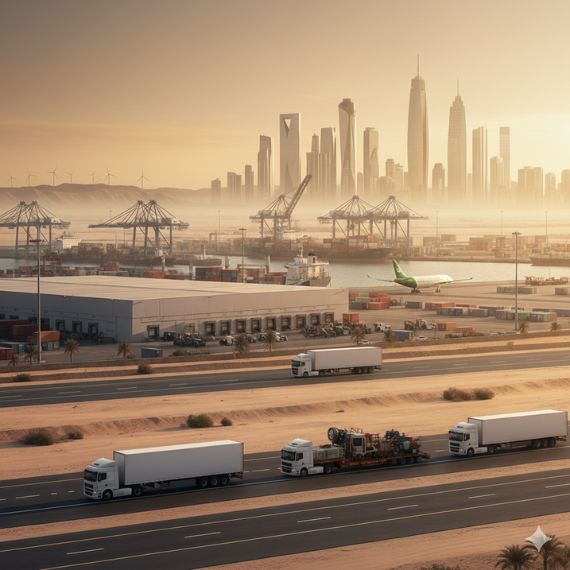
Australia occupies a significant role within the global freight forwarding sector due to its strategic geographical position and burgeoning economic connections with numerous nations. The escalating demand for e-commerce, cross-border trade, and the exploration of emerging markets are anticipated to drive the growth of Australia's cargo forwarding industry in the forthcoming years. The impact of the COVID-19 pandemic has further hastened the shift towards online shopping, resulting in a surge in air and sea freight deliveries.
Furthermore, the Australian government is making substantial investments in infrastructure development, including the modernization of ports, roadways, and railways, to enhance supply chain efficiency and reduce logistical expenses. This infusion of capital is fostering heightened competition among freight forwarding businesses, leading to more sophisticated and efficient supply chain operations.
The Australian Government's Heavy Vehicle Safety and Productivity Programme (HVSPP) allocates a yearly budget of up to USD 65 million to fund upgrades that enhance the safety and productivity of heavy vehicle operations across the country.
Collaborating with the private sector, the Australian government is also committing up to USD 14.5 billion to the Australian Rail Track Corporation (ARTC) for the creation of the Inland Rail project. It is projected that Inland Rail will contribute around USD 18 billion to the GDP during its construction and the initial five decades of operation.
Performance by Rail, Air, Road, and Marine Freight: In Australia, rail transport dominates other modes of domestic freight transit. A 5.7% increase in rail freight volumes is anticipated, partly as a result of anticipated future growth in exports of coal and iron ore.
- Rail Freight: Australia heavily relies on its rail freight system to transport commodities, with a notable emphasis on iron ore and coal. Collectively, these two commodities constitute over 75% of the nation's total rail freight volume by weight, holding significant importance for Australia's export activities. The rail freight sector is anticipated to reach its peak in 2024, primarily driven by the continued growth in iron ore and coal exports.
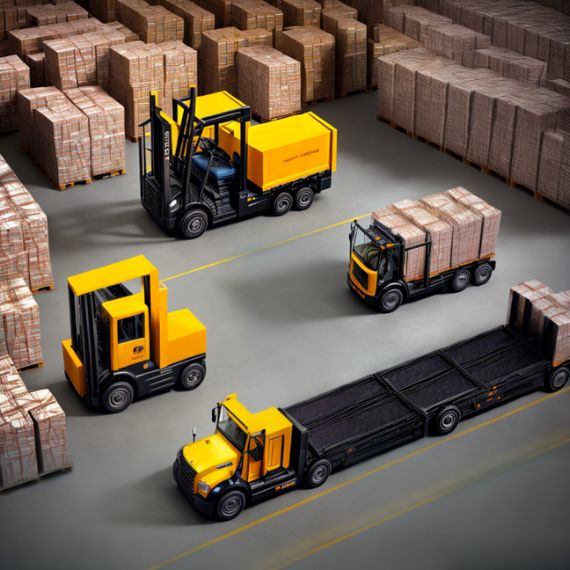
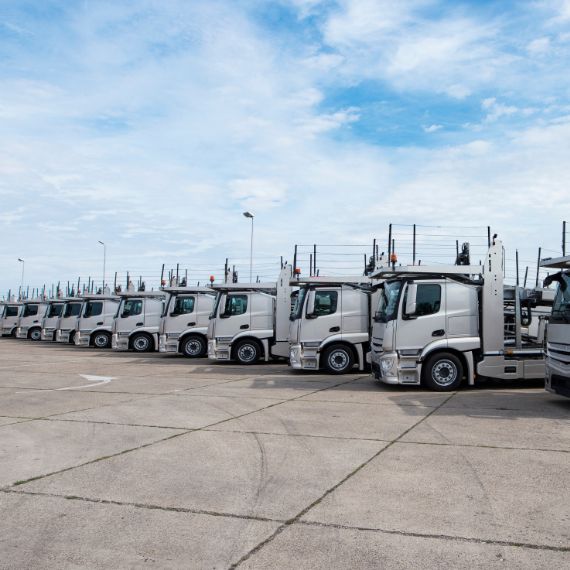
- Road Freight: Road freight is a critical component of Australia's logistics network, enabling the efficient transportation of goods between cities, regional areas, and remote locations. Due to the country's expansive geography and diverse economic activities, road transportation serves as a lifeline for businesses, industries, and consumers alike.
- Air Freight: Before the COVID-19 pandemic, a significant portion of Australia's air freight exports, around 82%, was carried by international passenger aircraft. However, the outbreak of the pandemic had a severe impact on the aviation industry, causing a steep decline in outgoing international flights from Australia. Despite the challenges posed by the pandemic, the International Air Transport Association (IATA) has projected a gradual rebound for global international flights. It is anticipated that international flights will reach approximately 69% of pre-COVID-19 levels in 2022 and further grow to 101% by 2025.
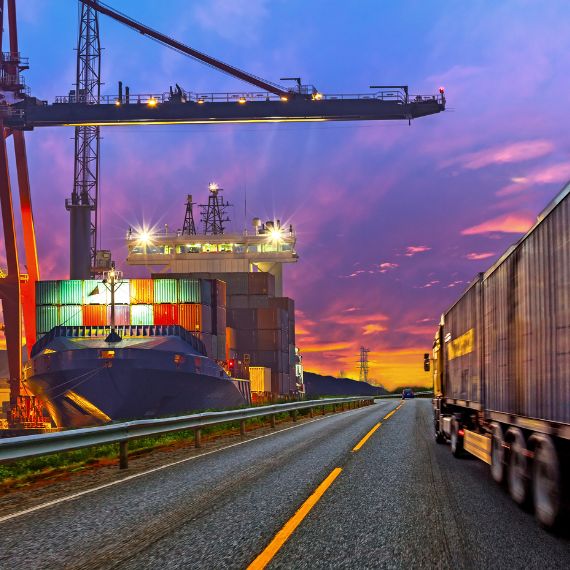
- Marine Fright: Australia maintains a coastal trading regime characterized by its emphasis on granting priority and unrestricted privileges to Australian-flagged vessels. Simultaneously, the regime also allows foreign-flagged vessels to engage in carrying domestic cargo, albeit under temporary licenses. The significance of coastal shipping cannot be overstated as it serves as a critical lifeline for numerous on-shore industries, including mining, agriculture, and refineries.
Iron ore and coal make up the majority (over 80%) of the country's exports by rail, which also carries over 58% of all domestic freight. One of the largest goods trains in the world runs over the Transcontinental Rail Line, which links the East and West coasts. It traverses the vast landmass of Australia.
Crude materials, such as building supplies, sand, stone and gravel, often make up the greatest portion of overall road freight volumes by mass, making up around 30-35% of all road freight tonnes lifted. Due to the widespread cancellation of development projects, it dramatically decreased in 2020.
Key Developments
- The thriving e-commerce market is a new development that has had an impact on the air freight business. Demand for air freight services has increased as a result of the growth of internet commerce. Costs associated with international air freight increased by an astounding 59% between January 2020 and April 2022.
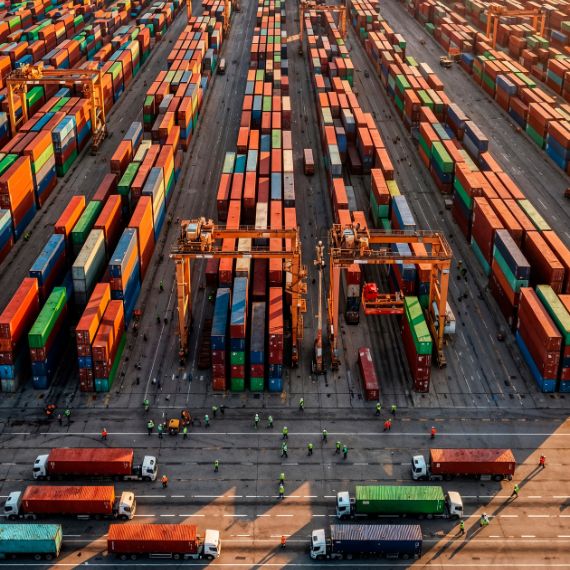
- Australia's marine exports reached USD 354.8 billion in 2020–21, up 1.3% in real terms from 2019–20 and 7.8% more than the average annual trend increase for the five years preceding to 2020–21. Australia exported 1516.1 million tonnes of goods by sea in 2020–21, a 1.0% decline from 2019–20, even though there was an average annual increase of 1.7% for the five years before to 2020–21.
Future Outlook
The outlook for Australia's freight forwarding market is positive, given the country's continued reliance on international trade. The industry is expected to evolve further with the integration of advanced technologies and a focus on providing more streamlined and customer-centric services. It is projected that the Australian goods forwarding industry sector would expand steadily in the years to come. It is anticipated that road freight volumes would increase rapidly. By 2050, demand may reach over 450 billion tonne-kilometres due to potential future economic expansion.
Rail freight volumes are expected to increase at an average pace, because of the anticipated slower growth in iron ore and coal exports over the next years. Volumes of domestic coastal shipping are anticipated to mostly stay at their present levels.
Scope of the study
The study conducted by Makreo Research on the “Australia Freight Forwarding Market Analysis by Mode of Transportation (Air, Sea and Land)” provides a comprehensive analysis of the freight market, encompassing a wide range of factors. The report takes into account both qualitative and quantitative factors, indicating a well-rounded approach to analysis. The inclusion of both qualitative and quantitative factors in the study ensures that readers gain a more complete understanding of the Australia Freight Forwarding Market. It goes beyond mere numbers and incorporates insights into consumer behavior, industry trends, and market dynamics. This holistic approach enhances the overall analysis and makes the study a valuable resource for individuals or organizations interested in exploring the Land Freight, Sea Freight, and Air Freight service market in Australia.
The report examines opportunity for the Australia Freight Forwarding Market on various grounds including
- Land Freight
- Air Freight
- Sea Freight
Key Questions Answered
- How Australian Freight Forwarding Market has performed in the past and present growth outlook?
- What is the condition of Australia's road network and how does it support the movement of goods across different regions?
- How has the Australian government addressed road, rail, waterways and air infrastructure development to support efficient and sustainable freight movement?
- How is the volume of Australia's domestic freight market distributed among various modes of transportation, such as road, rail, air, and sea?
- How Air, Land and Sea freight are performing in terms of volume of freight carried each year?
- Which Mode of Transport holds major market share in Australia Domestic Freight Market?
- What is the current market share distribution between bulk and non-bulk cargo transportation in the Australia domestic freight sector?
- How is the Australia road freight market volume distributed among various cargo types, including crude materials, manufactured goods, food and live animals, and others?
- Who are the major players operating in the road freight forwarding segment in the Australia market?
- Who are the prominent players operating in the rail freight forwarding segment of the Australia market?
Looking for a Section from Report? Start your Partial Purchase Request
Table of Contents
- Report Synopsis
- Key Industry Highlights
- Logistics Infrastructure in Australia
- 1.Research Methodology
- 1.1.Objective of the Study
- 1.2.Research Process
- 1.3.Data Collection Methods
- 1.4.Analytical Framework
- 2.Australia Logistics Infrastructure (Rail, Road, Sea Ports and Air)
- 2.1.Logistics Infrastructure in Australia : Road Transport
- 2.2.Logistics Infrastructure in Australia : Rail Transport
- 2.3.Logistics Infrastructure in Australia : Air Transport
- 2.4.Logistics Infrastructure in Australia : Maritime Transport
- 2.4.1.Australia Container Port Traffic
- 2.4.2.Australia Liner Shipping Connectivity Index
- 3.Australia Freight Forwarding Market – Mode of Transportation
- 3.1.Australia Freight Forwarding Market : Industry Structure
- 3.2.Australia Domestic Freight Market Segmentation by Mode of Transport (Rail, Air, Road, Marine)
- 3.3.Australia Domestic Freight Volume by Mode of Transport
- 3.4.Australia Freight Volume by Total Bulk and Non Bulk
- 3.5.Australia Domestic Freight Market by Bulk and Non Bulk
- 4.Australia Sea Freight Market Performance
- 4.1.Australia Sea Freight Movement
- 4.2.Australia Domestic Sea Freight Market : By State/Territory, By Mode of Transport – Shipping
- 4.3.Australia Sea Freight Performance : Bulk & Non Bulk and TEU
- 4.4.Australia Sea Freight Performance : Export Value and Export Weight
- 4.5.Australia Sea Freight Performance : Import Value and Import Weight
- 4.6.Pilbara Ports Performance : Cargo Handling
- 4.6.1.Pilbara Ports Authority Highlights
- 4.6.2.Pilbara Ports Authority Highlights
- 4.7.Port Headland Performance
- 4.7.1.Port Headland Cargo Weight Handled
- 4.8.Ports of Dampier Performance
- 4.9.Australia Sea Freight Cargo Loaded : by Region (NSW, Queensland Port)
- 4.10Australia Sea Freight Cargo Loaded : by Region (VIC, South Australia)
- 4.11.Australia Sea Freight Cargo Loaded : by Region (Western Australia Port, Tasmania Port)
- 4.12.Australia Sea Freight Cargo Loaded : by Region (Northern Territory Port)
- 5.Australia Air Freight Market Performance
- 5.1.Australia Air Freight : An Overview
- 5.1.1.Australia Air Freight : Domestic & International
- 5.1.Australia Air Freight : An Overview
- 6.Australia Land Freight Market Performance
- 6.1.Australia Rail Freight : An Overview
- 6.1.1.Australia Rail Freight Market : Bulk and Non-Bulk
- 6.1.2.Australia Rail Freight Market : by Type (Iron Ore, Coal, Non Bulk & Others)
- 6.2.Australia Road Freight Volume
- 6.2.1.Australia Road Freight Market : by Type (Crude Material, Manufactured Good, Food & Live Animals, and Others)
- 6.2.2.Australia Road Freight Market : by Bulk & Non Bulk
- 6.2.3.Australia Road Transport Market : by State/Territory
- 6.1.Australia Rail Freight : An Overview
- 7.Australia Freight Forwarding Market – Competitive Landscape
- 7.1.Australia Freight Forwarding Market Competition : Road Freight
- 7.2.Australia Freight Forwarding Market Competition : Rail Freight
- 8.Analyst Recommendations
- List of Tables & Figures
- Australia Air Freight Transport, 2015-2021
- Australia Port Traffic (TEU: 20 foot equivalent units), 2012-2021
- Australia Liner Shipping Connectivity Index
- Australia Domestic Freight Market by Mode of Transportation (%), 2022
- Australia Freight Forwarding Market by Revenue, 2022
- Australia Domestic Freight Volume by Mode of Transportation, 2022
- Australia Domestic Freight Total Bulk and Non Bulk, 2017 & 2019
- Australia Domestic Freight Total Bulk and Non Bulk, 2020 vs 2021
- Total Domestic Freight, by State/Territory, by Transport Mode – Shipping, 2018-19 to 2020-21
- Australia Port Freight Volume including total Bulk and Non-Bulk Movement, 2018-2021
- Australia TEU Handled by Sea Freight, 2018-2021
- Australia Port Freight Volume by Bulk Freight, 2018-2021
- Australia Port Freight Share by Bulk & Non Bulk Freight, 2021
- Export Value of International Freight in Australia, 2015-2019
- Export Weight of International Sea Freight in Australia, 2015-2019
- Import Value of International Freight in Australia, 2015-2019
- Import Weight of International Sea Freight in Australia, 2015-2019
- Pilbara Ports Authority Throughput, 2017-18 - 2021-22
- Total Imports of Pilbara Ports Authority, 2017-18 – 2021-22
- Total Exports of Pilbara Ports Authority, 2017-18 – 2021-22
- Throughput Across the Pilbara Ports Authority’s berth, 2017-18 – 2021-22
- Total Vessel Movements at Pilbara Ports Authority, 2017-18 – 2021-22
- Total Vessel Movements at Port of Ashburton, 2017-18 – 2021-22
- Total Vessel Movements at Port of Dampier, 2017-18 – 2021-22
- Total Vessel Movements at Port of Port Hedland, 2017-18 – 2021-22
- Cargo Weight Handled by Cargo in Port Hedland, Jan-Jun 2023
- Financial Year Cargo Statistics and Number of Vessels of Ports of Dampier, July-2022 - Jun-2023
- Cargo loaded at New South Wales (NSW) port, 2015-2021
- Cargo loaded at Queensland port, 2015-2021
- Cargo loaded at Victoria Ports Corporation (VIC) port, 2015-2021
- Cargo loaded at South Australia port, 2015-2021
- Cargo loaded at Western Australia Port, 2015-2021
- Cargo loaded at Tasmania port, 2015-2021
- Cargo loaded at Northern Territory port, 2015-2021
- Australia Air Freight (International & Domestic Freight), 2018-2021
- Australia Domestic Air Freight, 2018-2021
- Australia Rail Freight (Total bulk and Non Bulk Moved), 2018-2021
- Australia Rail Freight (Total bulk Moved), 2018-2021
- Australia Rail Freight Market by Type, 2022
- Australia Rail Freight Market by Type, 2022
- Australia Road Freight (Total bulk and Non Bulk Moved), 2018-2022
- Australia Road Freight Market by Type, 2019-2020
- Australia Road Freight (Total bulk Moved), 2018-2021
- Australia Road Freight Share by Bulk & Non Bulk Freight, 2021
- Total Domestic Freight, by State/Territory, by Transport Mode – Road
- Market Share of Major Player in Australia Road Freight, 2022 (%)
- Market Share of Major Player in Australia Rail Freight, 2022 (%)
Related Reports — Automotive & Transportation